Entity relationship diagram: Difference between revisions
No edit summary |
No edit summary |
||
| (One intermediate revision by the same user not shown) | |||
| Line 1: | Line 1: | ||
[[Category:Computer Science]] | [[Category:Computer Science]] | ||
As the name suggests, an '''entity relationship diagram''' shows '''entities''', their properties, and their relationships with other entities. It is | As the name suggests, an '''entity relationship diagram (ERD)''' shows '''entities''', their properties, and their relationships with other entities. It is the industry standard used to illustrate [[Relational database|relational databases]] graphically. | ||
== Definitions == | |||
The core of an ERD is the ''entity''. It is a definable "thing" that stores information. | |||
Both ''entity types'' and ''entity sets'' are groups of definable things. However, entity types are time-independent, whereas entity sets are entity types at a particular interval of time. ''An entity is an instance of an entity type''. | |||
=== Entity categories === | |||
Entities are categorized into strong, weak, and associative. A ''strong'' entity can be defined solely by its properties, making it unique to other strong entities of the same type, whereas a weak one cannot be defined solely by its properties and is usually tied to a strong entity. The difference can be thought of as one having a key and the other not having one. | |||
In contrast to the distinction between strong and weak by the uniqueness of an entity in its type, an associative entity is used to describe an association (relationship) between entities. Think of it as weak entities with multiple parents. | |||
[[File:ERD Cardinality.png|thumb|Figure 1. Cardinality diagram sourced from lucidchart]] | |||
=== Cardinality === | |||
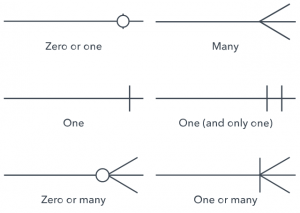
Lines are used to represent relationships between entity types in an ERD, and the ''cardinality'' of the relationship further describes that relationship in terms of the number on each side. Figure 1 illustrates all cardinality lines. | |||
= Sources = | = Sources = | ||
* https://www.lucidchart.com/pages/er-diagrams | * https://www.lucidchart.com/pages/er-diagrams | ||
Latest revision as of 01:21, 5 July 2024
As the name suggests, an entity relationship diagram (ERD) shows entities, their properties, and their relationships with other entities. It is the industry standard used to illustrate relational databases graphically.
Definitions
The core of an ERD is the entity. It is a definable "thing" that stores information.
Both entity types and entity sets are groups of definable things. However, entity types are time-independent, whereas entity sets are entity types at a particular interval of time. An entity is an instance of an entity type.
Entity categories
Entities are categorized into strong, weak, and associative. A strong entity can be defined solely by its properties, making it unique to other strong entities of the same type, whereas a weak one cannot be defined solely by its properties and is usually tied to a strong entity. The difference can be thought of as one having a key and the other not having one.
In contrast to the distinction between strong and weak by the uniqueness of an entity in its type, an associative entity is used to describe an association (relationship) between entities. Think of it as weak entities with multiple parents.

Cardinality
Lines are used to represent relationships between entity types in an ERD, and the cardinality of the relationship further describes that relationship in terms of the number on each side. Figure 1 illustrates all cardinality lines.
