Sampling Distribution: Difference between revisions
No edit summary |
|||
| Line 125: | Line 125: | ||
</math> | </math> | ||
Trust me bro. Remember to round down to use t-table. | Trust me bro. Remember to round down to use t-table. With this degree of freedom, we can use sample variance to estimate the distribution. | ||
[[Category:Sample Statistics]] | [[Category:Sample Statistics]] | ||
Revision as of 07:31, 13 March 2024
Let there be , where each is a randomv variable from the population.
Every Y have the same mean and distribution that we don't know.
We then have the sample mean
The sample mean is expected to be through a pretty easy direct proof
The variance of the sample mean is , also through a pretty easy direct proof.
Central limit theorem
The central limit theorem states that the distribution of the sample mean follows normal distribution.
As long as the following two conditions are satisfied, CLT applies, regardless of the population's distribution.
- The population distribution of is normal, or
- The sample size for each is large
By extension, we also have
where
Confidence Interval
Estimation is the guess for the unknown parameter. A point estimate is a "best guess" of the population parameter, where as the confidence interval is the range of reasonable values that are intended to contain the parameter of interest with a certain degree of confidence, calculated with
(point estimate - margin of error, point estimate + margin of error)
Constructing CIs
By CLT, . The confidence interval is the range of plausible .
If we define the middle 90% to be plausible, to find the confidence interval, simply find the 5th and 95th percentile.
Generalized, if we want a confidence interval of the middle , have a confidence interval of
where is the sample mean and is the z score of the x-th percentile.
T-Distribution

CLT has several restrictions, the biggest one being a large sample size. T-
Since we don't know the population variance , we have to use the sample variance to estimate it. This introduces more uncertainty, accounted for by the t-distribution.
T-distribution is the distribution of sample mean based on population mean, sample variance and degrees of freedom (covered later). It looks very similar to normal distribution.
When the sample size is small, there is greater uncertainty in the estimates. T-di
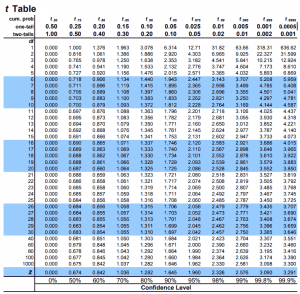
The spread of t-distribution depends on the degrees of freedom, which is based on sample size. When looking up the table, round down df.
As the sample size increases, degrees of freedom increase, the spread of t-distribution decreases, and t-distribution approaches normal distribution.
Based on CLT and normal distribution, we had the confidence interval
Now, based on T-distribution, we have the CI
Find Sample Size
To calculate sample size needed depending on desired error margin and sample variance by assuming that
We want to always round up to stay within the error margin.
I don't really know why.
Sampling Distribution of Difference
By linear combination of RVs, sampling distribution of is
However, we do not know the population variance . If the CLT assumptions hold, then we have
Trust me bro. Remember to round down to use t-table. With this degree of freedom, we can use sample variance to estimate the distribution.


