Curve fitting: Difference between revisions
(Created page with "'''Curve fitting''' is the process of defining/determining (''fit'') a function (''curve'') that best approximates the relationship between dependent and independent variables. * '''Underfitting''' is when models are too basic * '''Overfitting''' is when models are too complex, which may lead to incorrect predictions for values outside of the training data. = Underfitting = Visualize the fit of the model on the test data and bias variance tradeoff. If a model has ''hi...") |
No edit summary |
||
| Line 1: | Line 1: | ||
'''Curve fitting''' is the process of defining/determining (''fit'') a function (''curve'') that best approximates the relationship between dependent and independent variables. | '''Curve fitting''' is the process of defining/determining (''fit'') a function (''curve'') that best approximates the relationship between dependent and independent variables. | ||
* | * | ||
= Underfitting = | = Underfitting = | ||
| Line 10: | Line 9: | ||
= Error of the model = | = Error of the model = | ||
There are two types of bad fits: | |||
*'''Underfitting''', when models are too basic | |||
* '''Overfitting''', when models are too complex, which may lead to incorrect predictions for values outside of the training data. | |||
To measure these errors, we use ''bias'' and ''variance''. | |||
<math>\text{Error of the model} = \text{Bias}^2 + \text{Irreducible Error}</math> | <math>\text{Error of the model} = \text{Bias}^2 + \text{Irreducible Error}</math> | ||
If a model has high bias and low variance, the model undefits the data. If the opposite occurrs, it overfits. | If a model has high bias and low variance, the model undefits the data. If the opposite occurrs, it overfits. | ||
| Line 30: | Line 37: | ||
<math>MSE = \frac{1}{n} \sum (y_i - \hat{y_i})^2</math> | <math>MSE = \frac{1}{n} \sum (y_i - \hat{y_i})^2</math> | ||
It can be used to measure the fit of the model on the training and test data. | It can be used to measure the fit of the model on the training and test data. It is not a normalized value, so we use it in conjunction with another value to get the error in terms of percentage. | ||
The '''coefficient of determination''' (R^2) represents the strength of the relationship between input and output. | |||
<math>R^2 = 1 - \frac{\sum (y_i - \hat{y_i})^2}{\sum (y_i - \bar{y_i})^2} = 1 - \frac{n (MSE) }{\sum (y_i - \bar{y_i})^2} </math> | |||
where <math>\bar{y}</math> is the average. | |||
R^2 is normalized. | |||
= K-fold Cross Validation = | |||
'''K-fold cross validation''' is a technique used to compare models and prevent overfitting. It partitions randomized data into ''k'' folds (usually 10) of equal size, and use one unique fold for testing each time, calculating the above values. | |||
This avoids the problem of model only targeting training data | |||
Revision as of 18:54, 8 April 2024
Curve fitting is the process of defining/determining (fit) a function (curve) that best approximates the relationship between dependent and independent variables.
Underfitting
Visualize the fit of the model on the test data and bias variance tradeoff.
If a model has high bias and low variance, the model undefits the data
Error of the model
There are two types of bad fits:
- Underfitting, when models are too basic
- Overfitting, when models are too complex, which may lead to incorrect predictions for values outside of the training data.
To measure these errors, we use bias and variance.
Failed to parse (SVG (MathML can be enabled via browser plugin): Invalid response ("Math extension cannot connect to Restbase.") from server "https://wikimedia.org/api/rest_v1/":): {\displaystyle \text{Error of the model} = \text{Bias}^2 + \text{Irreducible Error}}
If a model has high bias and low variance, the model undefits the data. If the opposite occurrs, it overfits.
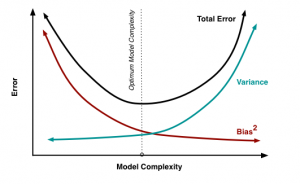
Bias Variance Tradeoff

Bias is the error between average model prediction and the ground truth
Failed to parse (SVG (MathML can be enabled via browser plugin): Invalid response ("Math extension cannot connect to Restbase.") from server "https://wikimedia.org/api/rest_v1/":): {\displaystyle \text{Bias}^2 = E [(E[g(x)] - f(x))^2 ]}
Variance is the error between the average model prediction and the model prediction
Failed to parse (SVG (MathML can be enabled via browser plugin): Invalid response ("Math extension cannot connect to Restbase.") from server "https://wikimedia.org/api/rest_v1/":): {\displaystyle \text{Variance} = E [(E[g(x)] - g (x))^2 ]}
Bias and variance have an inverse relationship.
Regression Models
Mean squared error uses the mean of a collection of differences between the prediction and the truth squared as a measurement for fit.
Failed to parse (SVG (MathML can be enabled via browser plugin): Invalid response ("Math extension cannot connect to Restbase.") from server "https://wikimedia.org/api/rest_v1/":): {\displaystyle MSE = \frac{1}{n} \sum (y_i - \hat{y_i})^2}
It can be used to measure the fit of the model on the training and test data. It is not a normalized value, so we use it in conjunction with another value to get the error in terms of percentage.
The coefficient of determination (R^2) represents the strength of the relationship between input and output.
Failed to parse (SVG (MathML can be enabled via browser plugin): Invalid response ("Math extension cannot connect to Restbase.") from server "https://wikimedia.org/api/rest_v1/":): {\displaystyle R^2 = 1 - \frac{\sum (y_i - \hat{y_i})^2}{\sum (y_i - \bar{y_i})^2} = 1 - \frac{n (MSE) }{\sum (y_i - \bar{y_i})^2} }
where Failed to parse (SVG (MathML can be enabled via browser plugin): Invalid response ("Math extension cannot connect to Restbase.") from server "https://wikimedia.org/api/rest_v1/":): {\displaystyle \bar{y}} is the average.
R^2 is normalized.
K-fold Cross Validation
K-fold cross validation is a technique used to compare models and prevent overfitting. It partitions randomized data into k folds (usually 10) of equal size, and use one unique fold for testing each time, calculating the above values.
This avoids the problem of model only targeting training data
