Logistic regression: Difference between revisions
No edit summary |
|||
| Line 11: | Line 11: | ||
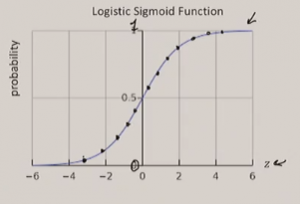
As shown in figure 1, the sigmoid is S-shaped. It is a good approximation of the transition from 0 to 1. | As shown in figure 1, the sigmoid is S-shaped. It is a good approximation of the transition from 0 to 1. | ||
As stated in the last section, we feed the output of linear regression into sigmoid. | As stated in the last section, we feed the output of linear regression into sigmoid. Sigmoid outputs a probability of 1. | ||
<math> | <math> | ||
sigm(z=wx)=\frac{1}{1+e^{-z}} | sigm(z=wx)=\frac{1}{1+e^{-z}} | ||
</math> | </math> | ||
Revision as of 01:27, 26 April 2024

Logistic regression uses the logistic function (sigmoid) to map the output of a linear regression function to 0 or 1.
Linear regression
Linear regression cannot be directly used for (binary) classification. Indirectly, a threshold is used. When the value is above the threshold, it is considered 1; when it is below, it is considered 0.
Classification using linear regression is sensitive to the threshold. The problem with this approach is the difficulty in determining a good threshold. Logistic regression mitigates that by feeding into a logistic function.
Logistic function
As shown in figure 1, the sigmoid is S-shaped. It is a good approximation of the transition from 0 to 1.
As stated in the last section, we feed the output of linear regression into sigmoid. Sigmoid outputs a probability of 1.


