Skewness: Difference between revisions
From Rice Wiki
No edit summary |
|||
| Line 7: | Line 7: | ||
Data skewness is detected during [[Exploratory data analysis]]. | Data skewness is detected during [[Exploratory data analysis]]. | ||
The first method is visualization. Just look at a graph lol. | The first method is visualization. Just look at a graph lol. Histograms and box plots will get the job done. | ||
Numerically, in a dataset, if the median < the mean, then it is skewed to the right. Vice versa. | Numerically, in a dataset, if the median < the mean, then it is skewed to the right. Vice versa. | ||
Latest revision as of 06:47, 26 April 2024
The skewness of a dataset determines the direction of the outliers.
Impact
Many models assume the data to be normally distributed. Skewed data in those models will result in inaccurate predictions.
Detection
Data skewness is detected during Exploratory data analysis.
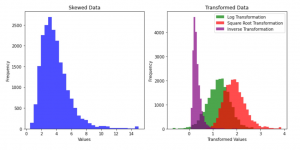
The first method is visualization. Just look at a graph lol. Histograms and box plots will get the job done.
Numerically, in a dataset, if the median < the mean, then it is skewed to the right. Vice versa.
Mitigate problems

Skewed data can be transformed to approximate a more symmetric distribution. Examples include logarithmic, square root, and inverse transformations.
